
Having written more complicated implementations of real-time foreign exchange data, it occurred to me that I missed a simple implementation of REST API for Python Forex users. So here we learn to consume current and historical currency data using Python and pandas.
Before we begin a caveat, you need to have an elementary understanding of Python, I mean, basics like the one that comes from watching "learn Python in under 10 minutes" videos. That said, this tutorial should be helpful to people with experience in other programming languages and people who would like to use our Forex REST API.
How to Fetch Data from API in Python
You must sign up for our API and click Join API for Free. Once you have the API key, please note it in a safe place. The API and Python environment is all you need, to follow this tutorial. For simplicity, I would recommend users with no Python Key setup head to Google Colab and launch a Jupyter Notebook. For those who have Python installed, these programs can be run locally.
You will need to install a few libraries, but for 'Colab,' you don't need to install them; you should import them. If you are a beginner to Python or want to test a bit of code quickly, Collaboratory from Google is very good.
Calling Real-time Currency Rates Using Live Endpoint
  import requests
  from pprint import PrettyPrinter
  pp = PrettyPrinter()
You can copy-paste the above code into a cell on Google Colab Notebook and then hit shift+enter or click the play button.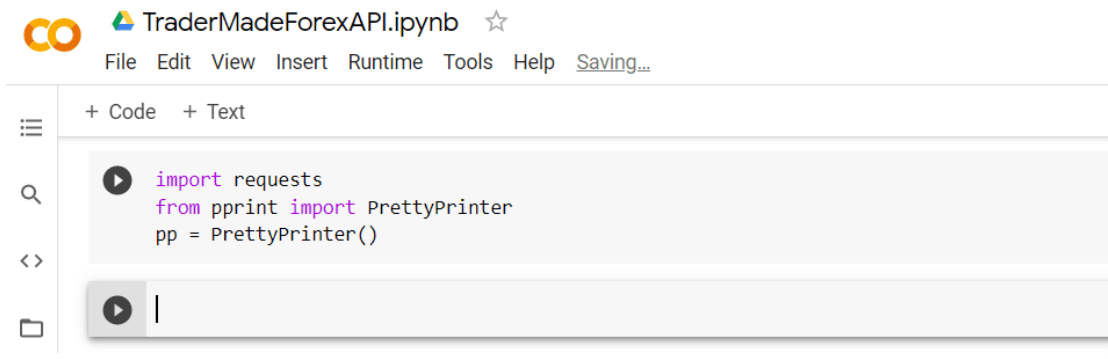
We can see the cell has run, and we have a new block to write our lines of code. Before we run the code below, we need to understand what it means. The url is the endpoint we call; the currency is a comma-separated string, and you can obtain an api_key by signing up.
We will need the requests library to call the FX API, which we imported in the previous cell. The requests library has a get function that takes in a URL and a JSON parameter. In this case, it is the "querystring." The response is what we get back from the API, all our requests and responses are SSL-encrypted. We then print the response we receive using PrettyPrinter. So, it looks nice.
  url = "https://marketdata.tradermade.com/api/v1/live"

  currency = "USDJPY,GBPUSD,UK100"
  api_key = "api_key"
  querystring = {"currency":currency,"api_key":api_key}

  response = requests.get(url, params=querystring)

  pp.pprint(response.json())
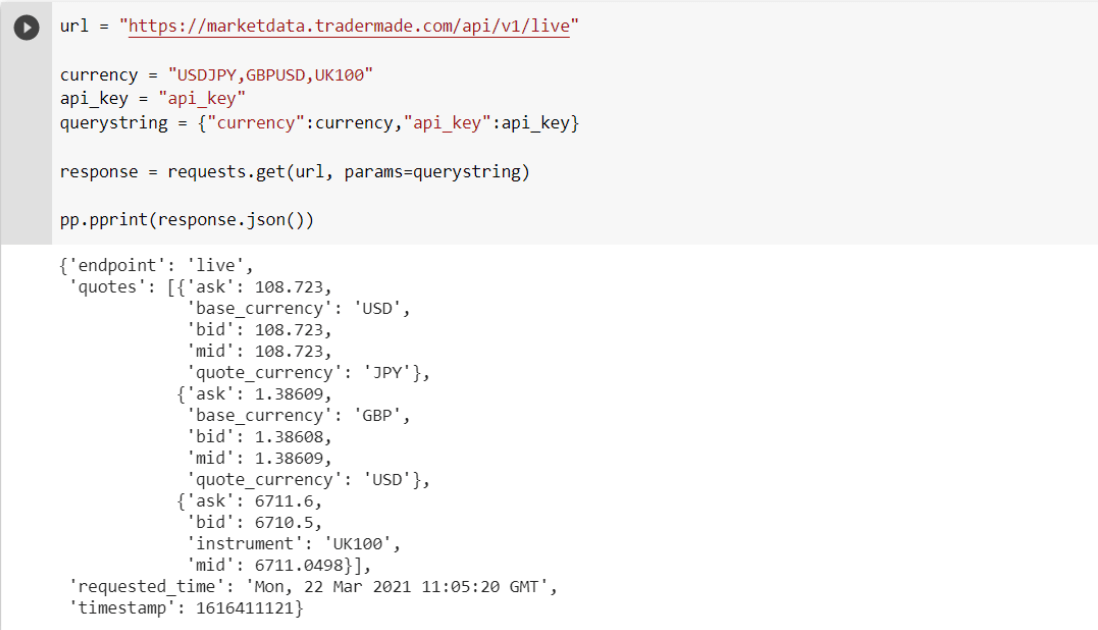
We have received live rates for USDJPY, GBPUSD, and FTSE100 in not more than 6 lines of code. As you can see it is easy to get exchange rates in Python, however, to do some data analysis or see the rates in a more presentable way, we will need to put them in a table or, as we call it, 'DataFrame' in pandas.
So here we would like to introduce pandas, an extensive library created for data analysis. Pandas simplify iterating, tabulating, modifying, and calculating data. But for this tutorial, I'll keep the scope limited to getting, saving, and tabulating data from the API. So let's continue.
  import pandas as pd
  df = pd.DataFrame(response.json()["quotes"])
  df
Pandas can also get the data from the API. For better understanding, here we have used requests. The 'requests.get' function is useful if the data requested is not an exact data frame. We pass in quotes we received in our response.json into a pandas function that converts data into a data frame, and voila! We now have our data tabulated in 1 line of code.
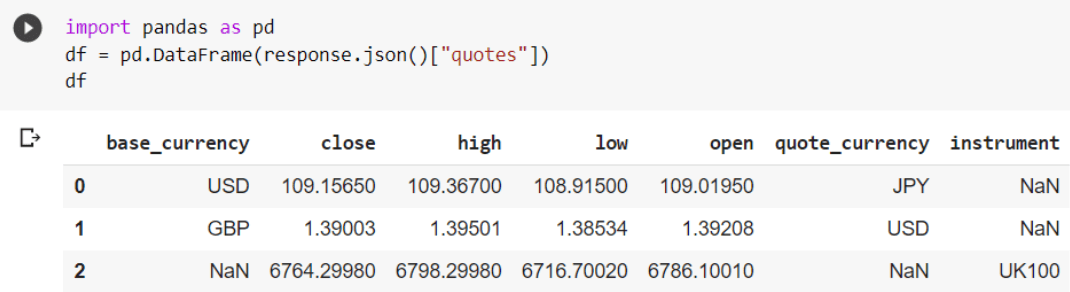
The pandas' data frame above is more readable. But we are still not there. We will make some adjustments to make it more readable. We can see we have NaN in the instrument column, and ask, bid, and mid is not in order. Similarly, we don't have a timestamp, so let's fix that quickly.
  # if all instruments are currencies just write a # in front of line 1 and take # off line 2 in the below code. If all instruments are CFDs just write # in line 1 and 2.
  import numpy as np
  df["instrument"] = np.where(df["base_currency"].isnull(),df["instrument"],df["base_currency"]+df["quote_currency"])
  #df["instrument"] = df["base_currency"]+df["quote_currency"]
  df["timestamp"] = response.json()["timestamp"]
  df["timestamp"] = pd.to_datetime(df["timestamp"], unit="s")
  df
We will import NumPy, another library that complements Pandas' library. Then change the instrument column using the "np.where" function, which takes in (conditions- 'is true' and 'if false'), and then will create a new column called timestamp and write the timestamp we received from API response.json and convert it to a readable timestamp.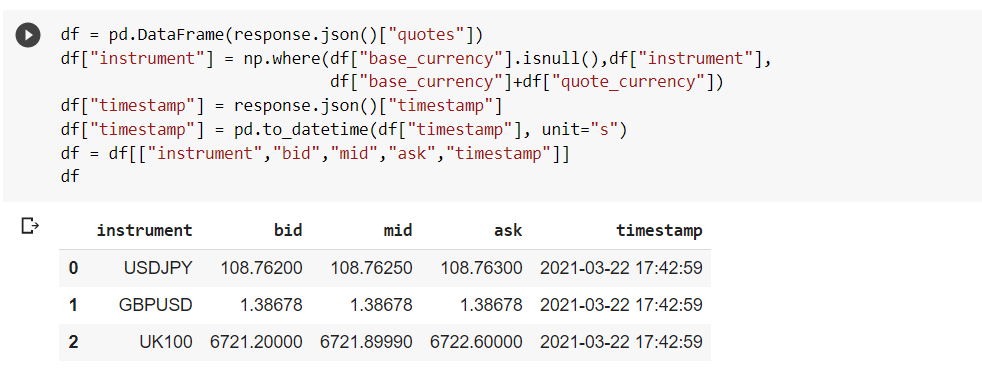
You can now see why Pandas is so widely used and how Python is productive. And all this code executes fast. You can also do this:
![]()
You can save your work with a single command, as shown below, and share your work via a CSV file.
df.to_csv('live_rates.csv')
We also provide a conversion rate endpoint to convert from one currency to another. For example, to the Euro rate from USD. You can see the FX Python implementation of our Conversion API endpoint.
For an in-depth overview of our endpoints check out our REST API Data Documentation page. This includes the status code and error info.
Calling Historical FX Data Using Historical Endpoints
Daily Historical
The Daily Historical data endpoint is very similar to the live endpoint. The only difference is instead of timestamp, the response JSON has a date, and instead of the bid, mid, and ask in quotes, we have open, high, low, and close. We have already defined currency and api_key. So all we need to provide is a date we require data for.
  url = "https://marketdata.tradermade.com/api/v1/historical"
  date = "2021-03-15"
  querystring = {"currency":currency,"date":date, "api_key":api_key}
  response = requests.get(url, params=querystring)
  df = pd.DataFrame.from_dict(response.json()["quotes"], orient='columns', dtype=None, columns=None)
  df["instrument"] = np.where(df["base_currency"].isnull(),df["instrument"],df["base_currency"]+df["quote_currency"])
  df["date"] = response.json()["date"]
  df["date"] = pd.to_datetime(df["date"])
  df
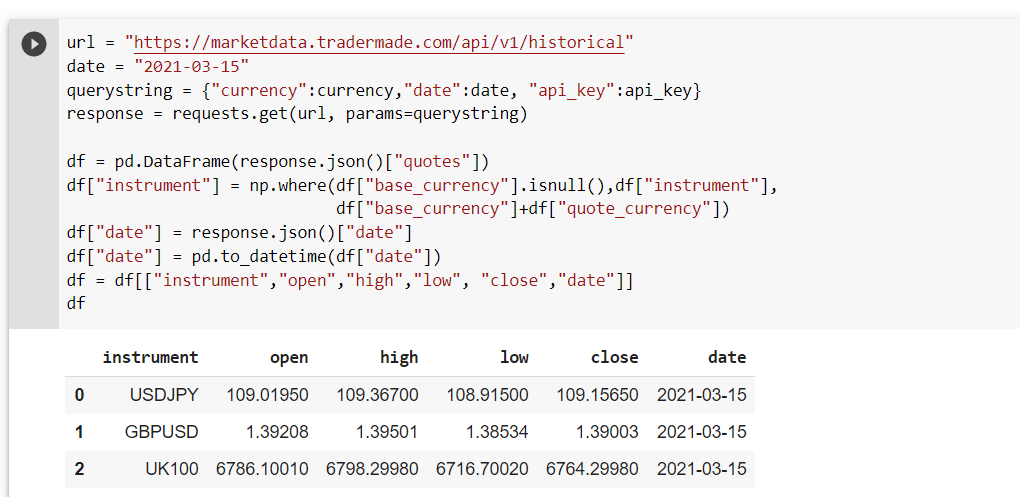
It is easy to make tables out of data, and it's not far-fetched to think that, with some pandas magic, you can slice the data as you want. You can also loop through the requests and ask for data for different dates. The possibilities are endless. For the other two data historical endpoints: minute_historical and hour historical, you can only call one rate per currency at a time. So there is a need to loop through the data.
Minute and Hour Historical
The calls for both endpoints are almost identical. So will use one example for a minute history, as shown below:
  fx = ["EURUSD", "USDJPY"]
  dates = ["2021-03-15-13:00"]
  array = []
  url = "https://marketdata.tradermade.com/api/v1/minute_historical"
  for i in fx:
      for date in dates:
          querystring = {"currency":i,"date_time":date, "api_key":api_key}
          response = requests.get(url, params=querystring)
          array.append(response.json())
  df = pd.DataFrame(array)
  df
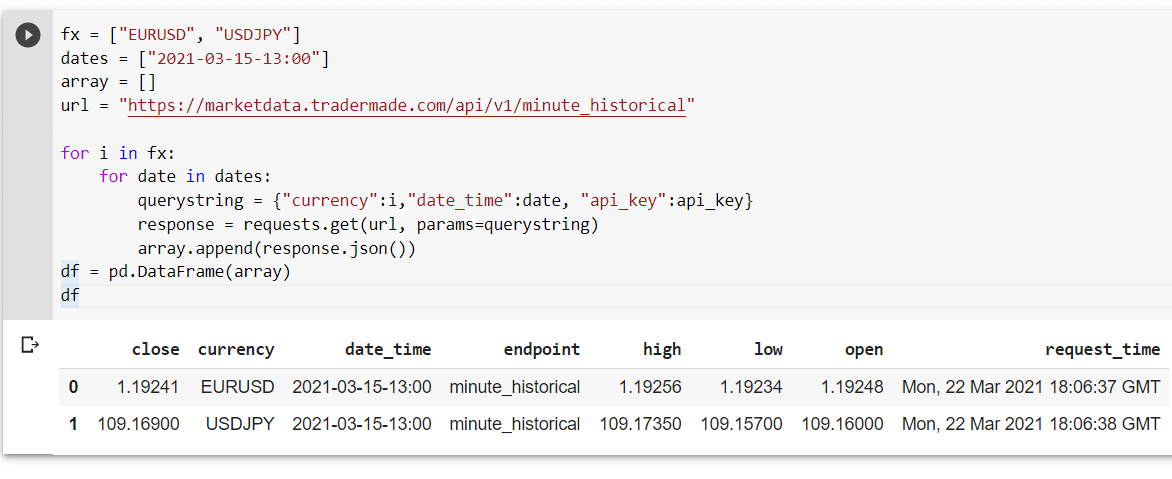
By now, we can see it's not very difficult to ask for different FX rates in Python. With some work, it is possible to make a system that checks rates and highlights some alerts based on some conditions we preset. However, this is outside the scope of this article, and we advise exploring pandas, a handy library for data analysis.
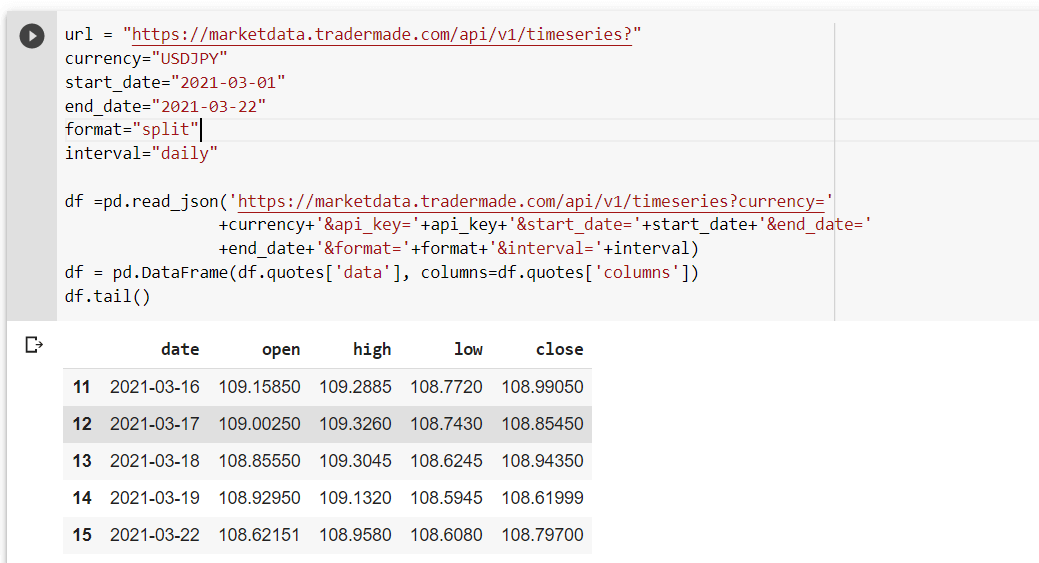
Calling Timeseries FX Data Using the Timeseries Endpoint
If you request historical endpoints, the request is of a price at a specific time. We will now look at the time series used for trend analysis and charts and get data in chunks. This is useful for forex trading backtesting. In this instance, we will not use the requests library instead the Pandas library will be used entirely.
  url = "https://marketdata.tradermade.com/api/v1/timeseries?"
  currency="USDJPY"
  start_date="2021-03-01"
  end_date="2021-03-22"
  format="split"
  interval="daily"

  df =pd.read_json('https://marketdata.tradermade.com/api/v1/timeseries?currency='
                +currency+'&api_key='+api_key+'&start_date='+start_date+'&end_date='
                +end_date+'&format='+format+'&interval='+interval)
  df = pd.DataFrame(df.quotes['data'], columns=df.quotes['columns'])
  df.tail()
The pandas can request data from an API using a function like read_json or read_csv. Our currency data API timeseries endpoint takes in a parameter called format. When that format is set to "split," it's easy to convert it into a pandas data frame. We then read the columns that passed in from the API. Then print the last five lines of data we have received using the command df.tail(). If you want to see the first five data points, do df.head().
Data is already formatted in a way that's easy to play. We can also make a similar request for hourly and granular data. All we need to do is add minor changes like start_date, end_date changed to "YYYY-mm-dd-HH:MM" and interval changed to hourly. You can see below:
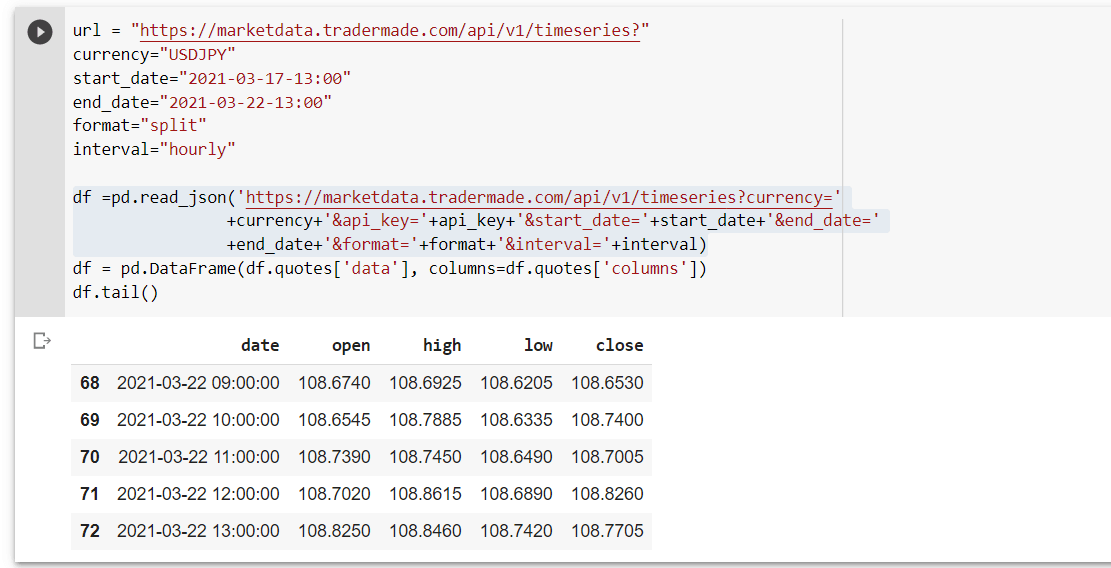
We can do several things with the above data frame, like making an extra column for range, % change, rolling correlation, and volatility. However, that is outside the scope of the article. You can check out our data visualization article that shows basic Pandas commands for correlation and volatility.
Calling Tick Historical FX Rates Using Tick Sample Endpoint
Finally, we will look at historical tick data, which is very useful for serious data analysis, including trading algorithms and machine learning.
However, tick data can be used for many purposes. We will be able to get our data in a pandas data frame in one line of code from our rest API. Before we run our code one reminder, the tick data is available to free users for only the past four days, not including today, you can't request more than thirty minutes in one single request on a free plan, and it will cost 20 API requests for each call.
So I would advise saving the file locally using df.to_csv("example.csv") and then reading it in by df.read_csv("example.csv"). Also, one reminder for Google Colab users because there is a gap in our start date and end date format for the tick data endpoint, we will need to fill that gap with "%20". This is something I noticed in the Google Collaboratory Notebook. You don't need to do it in Jupyter Notebook or Python script.
  currency="EURUSD"
# start date is 2021-03-22 14:00 but %20 is added to the gap as url dont like empty spaces (this is added automatically but Google Colab doesnt seem to like this)
  start_date="2021-03-22%2014:00"
  end_date="2021-03-22%2014:30"
  format="csv"

  url = "https://marketdata.tradermade.com/api/v1/tick_historical_sample/"+currency+"/"+start_date+"/"+end_date+"?api_key="+api_key+"&format="+format

  df =pd.read_csv(url)

  df.tail()
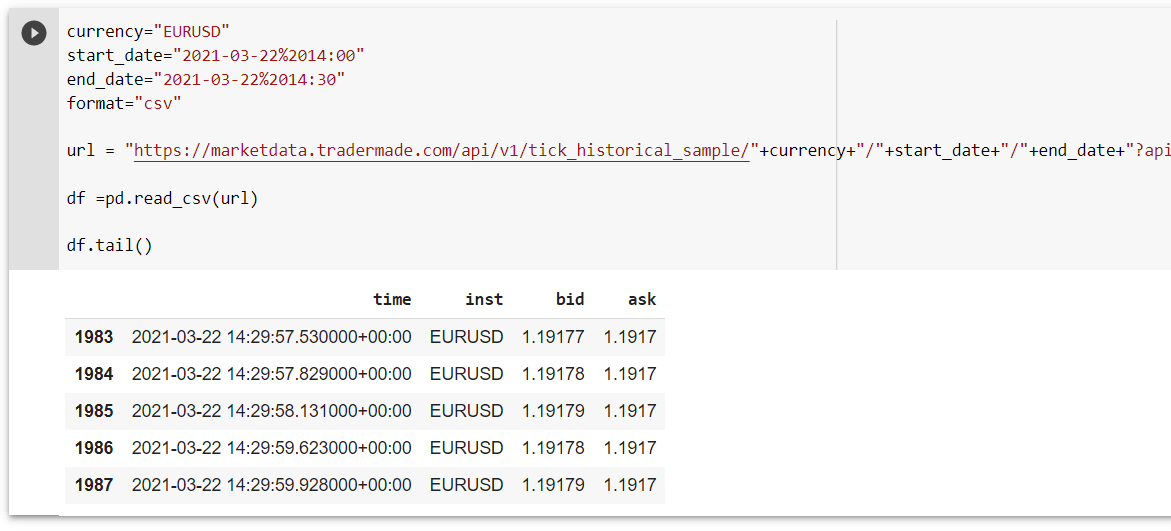
As you can see, you have just pulled almost 2000 tick historical data points for EURUSD. You can get the Jupyter Notebook file from our Tradermade GitHub page. This article helps beginners and experienced programmers get data from the Forex REST API using Python and Pandas. Please leave a message on our contact page for a suggestion. You can also request any future article you want to see.