Background
Traditional methods of chart analysis use bar or point and figure charts. Yet over 100 years before these
methods
originated, the Japanese were using their own style of technical analysis in the rice market. This style
evolved
into the candlestick techniques currently used in Japan.
In the 1600s the Japanese were trading forward contracts in rice-called "empty rice", because they were
trading
rice that wasn't there. Rice was not only Japan's main staple, but it underpinned the economy. Samurai
warriors'
salaries were rice stipends. These stipends were derived by a rice tax levied by the government. From the
peasant on up, the price of rice was crucial.
Although they were not the first to trade forward contracts (the Dutch were in the l 500s), the Japanese
were
the first to use technical analysis. It's believed Japanese price charts originated around 1750. Some
patterns
used by the Japanese are similar to our own, but were discovered much earlier. For example, the equivalent
of
our head and shoulders formation was predated by the Japanese three Buddha pattern. This was related to the
Buddhist temples in which there is a large central Buddha with saints on both sides -a perfect analogy to a
head
and shoulders.
With their extended historical foundation, Japanese candlestick patterns can offer us new insights. Their
picturesque names also make them fun to use. Expressions such as "dark cloud covers," "morning stars," and
"windows" abound.
These techniques offer a wide spectrum of applications:
- Candlestick charts are a useful stand alone tool. They can also be merged with other technical tools to
create a synergy of techniques.
- Knowing how the Japanese analyze markets provides valuable information given the extent of their
participation in the U.S. financial markets.
- Certain Japanese candlestick combinations may imply a period of consolidation (therefore a decline in
volatility), others hint of a forceful price move (thus a rise in volatility). They give deeper insight
into
market conditions that could provide benefits to option traders.
The Japanese method of plotting is called
candlesticks because the daily lines resemble candles. The candlestick lines, alone and in combination,
provide valuable assistance in trading. This report uses American names for the indicators. The "tsutsumi"
line is a line that "engulfs" the prior day's price action. So this is called an engulfing line. The
Japanese names are in parenthesis. Indicators are illustrated and shown in chart examples.
The patterns illustrated are representative examples. The lines don't have to
look exactly as they do in the illustrations to provide a valid signal. And, as with all charting methods,
formations are somewhat subject to the interpretation of the user.
Reading the Candlestick Lines
The daily candlestick line illustrates the market high, low, open and close. The thick part of the
candlestick is called the "real body". It represents the range between the open and close. When the real
body is black (i.e., filled in), as in the Long Black Body below, it means the close was lower than the
open. If, as in the Long White Body below, the real body is white (i.e., empty), it means the close was
higher than the open.
The thin lines above and below the real body are called the "shadows" and they represent the high and low of
the day. The Long Black Body shows a close near the low of the day. The Long White Body shows a close near
the high of the day. The relationship between the day's open, high, low and close change the look of the
daily candlestick.
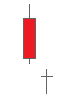
Long Black Body. This represents a bearish period in the market. Prices experienced a wide range, and the market opened near the high and closed near the low of the period.
Long White Body. This is the opposite of a long black body, and represents a bullish period in the market. Again, prices experienced a wide range, however, the market opened near the low and closed near the high of the trading period.
Spinning Tops. These are small real bodies, and can be either black or white. The small body repre-sents a relatively tight range between the open and close for the period. In a trading range environ-ment, spinning tops are neutral, but they may be-come important as parts of other chart patterns . (Sec stars and harami later in this report.)
Doji Lines. These illustrate periods where the opening and closing prices for the period arc the same. The length of the shadows can vary. As you '11 sec throughout this report, doji lines arc important in a variety of patterns.
Software Solutions
TraderMade offer a number of solutions for working with Candlestick Patterns.
Professional Charting
TraderMade's Professional Research portal contains to accurately identify patterns in any chart that they have on our platform. Candlestick Patterns have been developed over time and are empirically proven, sentiment based prediction of the future market directionality based on patterns found in recent market data.
Out Technincal Analysis Charting Application Professional Charting has built in Candlestick Pattern Recognition
Research Portal
TraderMade's Professional Research portal contains to accurately identify patterns in any chart that they have on our platform. Candlestick Patterns have been developed over time and are empirically proven, sentiment based prediction of the future market directionality based on patterns found in recent market data.
Questions and Answers
What candlestick pattern is the most reliable?
The tried a testes candlestick patterns that give good results and are east to identify: Doji, Bullish Engulfing Pattern, Bearish Engulfing Pattern, Morning Start and Evening Star.
How many types of candlestick patterns are there?
The short answer is many, and many that you will never see. The best thing to do is concentrate on the the few core patterns that give strong reversal signals and an opportunity to buy. You can read more in our free course.
Is candlestick charting reliable?
Not all candlestick patterns are reliable but there is a core group that are easy to identify and give good signals. Combined with other influencing factors and research they can prove a valuable and reliable tool.
Do you provide a free candlestick pattern course?
Yes click here Candle Stick Pattern Course
Candlestick Pattern Definitions
Dark Cloud Cover |
Doji |
Doji Star |
Dragonfly Doji |
Engulfing Patterns |
Evening Star|
Hammer|
Hanging Man|
Harami|
Harami Cross|
High Wave|
Hikkake|
Long Black Body|
Long Legged Doji|
Morning Star|
Piercing Lines|
Rickshaw Man|
Shooting Star|
Short Line|
Spinning Tops|
Three Black Crows|
Tweezer Bottoms|
Tweezer Tops|
Dark Cloud Cover Candlestick Pattern
The Dark Cloud Cover is a bearish pattern. This is the opposite of the piercing line. A strong
white body is
immediately followed by a black body. To qualify as a Dark Cloud Cover, the black body must open
above the
high - and close below the centre of - the previous white body.
The Dark Cloud Cover has more significance as a top formation than the piercing line does as a
bottoming
formation. This is because tops are often formed faster than bottoms. Lows are made by
indifference.
Investors may be attracted to other markets, and in no rush to enter. This explains why bases
often build
over a relatively long period of time. At tops, however, there is more of a rush to get out.
Thus, tops are
often made more swiftly than are bottoms.

Dark Cloud Cover
Doji Candlestick Pattern
These illustrate periods where the opening and closing prices for the period are the same. The
length of the
shadows can vary. Doji lines are important in a variety of patterns.

Doji
Doji Star Candlestick Pattern
The Doji Star appears after a prolonged move, and is composed of a gap and a Doji line (when the
open and the close are the same price). This is often the sign of an impending top or bottom.
Doji Stars often mark imminent turning points in the market, but more conservative traders
should wait for the next day’s body to confirm a change in price trend.
Doji Star
Dragonfly Doji Candlestick Pattern
The Doji Star appears after a prolonged move, and is composed of a gap and a Doji line (when the
open and the close are the same price). This is often the sign of an impending top or bottom.
Doji Stars often mark imminent turning points in the market, but more conservative traders
should wait for the next day’s body to confirm a change in price trend.

Dragonfly Doji
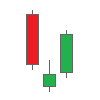
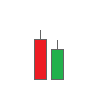
Engulfing Patterns Candlestick Pattern
The engulfing pattern is a strong reversal signal, especially after a prolonged trend. Only the
real body is important in this formation; shadows are virtually ignored.
The bearish engulfing pattern has a black real body that engulfs the prior day’s white real
body. This pattern is bearish during an uptrend. Conversely, a white body at the bottom of a
downtrend that engulfs the prior day’s black body is a potentially bullish signal.
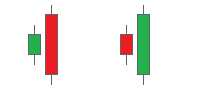
Bearish - Bullish
Engulfing
Evening Star Candlestick Pattern
The Evening Star formation is the reverse of the Morning Star and is a signal of a potential top
in the market. After a long white body, we see a upside gap to a small real body. This is
followed by a black body that closes above the midpoint of the white body made just before the
star.
Aptly named because it appears just before darkness sets in, the evening star is a bearish
signal. Basically, the Evening Star is similar to a dark cloud cover with a “star” in the
middle.
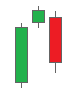
Evening Star
Hammer Candlestick Pattern
Umbrellas can be either bullish or bearish depending on where they appear in a trend. If they
occur during a downtrend, they are called hammers and are bullish, as in “the market is
‘hammering out’ a base”.
Hammers are excellent signals of a market at or near its bottom. At times, they are also
important at the lower end of the congestion band.

Hammer
Hanging Man Candlestick Pattern
Umbrellas can be either bullish or bearish depending on where they appear in a trend. If they
occur during an uptrend, they are called hanging man and are bearish, as in “the market is
‘hammering out’ a base”.
The ominous name of the hanging man line (derived because it looks like a hanging man with
dangling legs) hints at its bearish nature. If one appears at the top of a prolonged uptrend,
it’s usually time to vacate long positions.
Hanging Man
Harami Candlestick Pattern
This is similar to an inside day in contemporary Western analysis. But while an inside day is
usually considered neutral, the Harami Line is an indication of a waning in momentum. The small
body of the Harami line is contained within the long body directly preceding it.
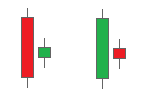
Bearish - Bullish
Harami
Harami Cross Candlestick Pattern
This is similar to an inside day in contemporary Western analysis. But while an inside day is
usually considered neutral, the Harami Cross is an indication of a waning in momentum.
Harami Cross indicates that the market is at a point of indecision and a trend change, or
reversal, is possible. We have found that the Harami Cross pattern is useful in forecasting
trend changes - especially after a long white body in an uptrend.
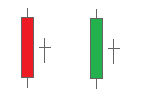
Bearish - Bullish
Harami Cross
High Wave Candlestick Pattern
The High Wave pattern has a small body and longer shadows and represents uncertainty and lack of
consensus in the market therefore a potential change in the trend.

High Wave
Hikkake Candlestick Pattern
The Hikkake pattern is similar to the Three Inside Up pattern but with no restraints. This
pattern does not require a downtrend nor does the direction of the candles. This can be both a
continuation of a trend or reversal depending on the direction of the breakout - above or below
the previous high/low.

Bearish - Bullish
Hikkake
Long Black Body Candlestick Pattern
This represents a bearish period in the market. Prices experienced a wide range, and the market
opened near the high and closed near the low of the period.
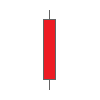
Long Black Body
Long Legged Doji Candlestick Pattern
Similar to the Rickshaw Man candlestick pattern, the candle has long upper and lower shadows
meaning that the price has moved up and down significantly before it closed or near to the
opening price.

Long Legged Doji
Long White Body Candlestick Pattern
This is the opposite of a long black body, and represents a bullish period in the market. Again,
prices experienced a wide range, however, the market opened near the low and closed near the
high of the trading period.
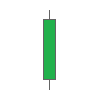
Long White Body
Morning Star Candlestick Pattern
The Morning Star pattern is a signal of a potential bottom in the market. It is aptly called a
Morning Star because it appears just before the sun rises (in the form of higher prices). After
a long black body, we see a downside gap to a small real body. This is followed by a white body
that closes above the midpoint of the black body made just before the star. The Morning Star is
similar to a piercing line with a “star” in the middle.
Morning Star
Piercing Lines Candlestick Pattern
The piercing line is a bullish pattern. This combination is composed of a long black body
followed by a white body. The white body should open lower and then close above the centre of
the black body. Basically, the market gaps lower on the opening and then retraces to close above
the midpoint of the previous period’s black body. If the white body does not “pierce” this
halfway point, more weakness can be expected in the market. We have found this pattern to be
most significant in a downtrend, or at the lower end of a congestion band.
Bullish - Bearish
Piercing
Rickshaw Man
The Rickshaw Man is a reversal pattern, which indicates indecision and a lack of direction - and
when formed in a strong trend it therefore signals a reversal.

Rickshaw Man
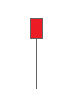
Shooting Star
The Shooting Star pattern appears at short-term tops in the market, and is a bearish signal. As
its name suggests, the Shooting Star is a small real body at the lower end of the price range
with a long upper shadow.

Shooting Star
Spinning Tops
The Spinning Top is a reversal pattern, this occurs when a small body has a long upper and lower
shadow, which are at least twice as long as the body.
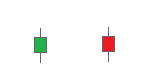
Bullish - Bearish
Spinning Top
Three Black Crows
Crows being an ominous bird, this is a bearish pattern. After a long white body we see a series
of three black bodies. There is an upside gap between the white body and first black body.
Shadows are ignored. The second black body closes lower than the first. Although an upside gap
is usually bullish in contemporary analysis, this pattern is bearish in candles.
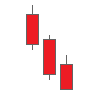
Three Black Crows
Tweezer Bottoms
In a falling market, a Tweezer Bottom is formed when the lows are the same (including any lower
shadows). We have found that the Tweezer is more important when it confirms either another
bearish line (for a top) or bullish line (for a bottom).
Tweezer Bottoms
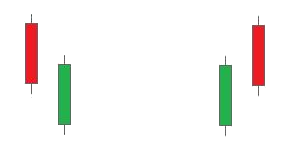
Tweezer Tops
A Tweezer formation is simply two lines with matching highs or lows. The Tweezer could be
composed of candle lines with real bodies and/or dojis, and could occur on consecutive or nearby
periods. The pattern is similar to the double top or bottom in traditional Western technical
analysis.
In a rising market, a Tweezer Top is formed when the highs, including any upper shadow, match on
consecutive or nearby periods. This would be a bearish reversal indicator.

Tweezer Tops