Chapter 1: Support and Resistence
1.1 Introduction
One of the most important concepts in technical analysis is the concept of trend. The technical analyst
operates on the assumption that prices move in trends, the goal is to identify the trend as early as
possible in order to trade in that direction. Trend can be defined as the direction of the market.
The markets rarely move in straight lines but through a series of peaks and troughs that are
referred to resistance and support levels respectively.
It is the direction of these successive highs and lows which constitutes the market trend. Hence,an
uptrend is defined as a series of successively higher lows and higher highs,
while a downtrend is a series of successively lower highs and lower lows.
1.2 Support and Resistance Levels
The basic idea behind these support-resistance theory is that the understanding of the future lies in
the past. Price levels that were significant in the past will be of importance for the price action in
the future.
Usually a support or resistance level is identified by previous lowsb> or previous highs
and
is a level beyond which process may have difficulty in moving. They are therefore considered important
levels in connection with buying and selling decisions.
Big Figures often
become psychological resistance or support levels. We see this happen in all markets. The bigger the
figure, the bigger the support or resistance.
Price projections and
retracementsalso
give areas for support and resistance on a chart. The Fibonacci series gives us a key percentage for
both projections and retracements.
Recent Support at 1.1172 can be seen on the EURUSD chart above.
Role Reversal
When a support or resistance levels breaks it often reverses roles, i.e. support becomes resistance and
resistance becomes support. So it is important to note old levels of support and resistance for the
future.
Trading Strategy
Once a level becomes support or resistance, when the price once again trades to that level a position
should be taken on the assumption that the level will once more hold with a stop (and reverse) the other
side of the line. It is important to note that the longer a price has been support or resistance and the
more times the level has been touched and held the more important the level.
1.3 Trendlines
Trendlines are harder to visualise than support and resistance lines. They are diagonal lines that
either define an area of support in the market or an area of resistance. It identifies the current trend
of a market and a break of the trendline indicates either a reversal or a retracement in that trend.
An uptrend is a succession of higher highs and higher lows and a downtrend is a succession of lower highs and lower lows.
It is very important to draw a trendline correctly. Unlike a support or resistance line, two points are
needed to draw a trendline but a third point is needed to confirm it. The more touches and the longer
the trendline has been in place the more important it is.
In an uptrend a line is drawn connecting the lows to form a trendline. This is because the buyers in
market are pushing the market in an uptrend. As analysts we are not looking to sell at the top of a
market, we are looking to buy into an uptrend. We need to know that following a period of retracement
back to the supporting trendline buyers reenter the market and push the market back up. If this fails to
happen, then there could be a trend reversal. The vice versa is true for a downtrend.
A correctly drawn downtrend
Filters - validity of the trendline breaking
A basic trend change signal is created when either a support or resistance line has been penetrated. The
use of Time and/or Price Filters is
a common method of trying to avoid false signals:
Time filters
-
Some suggest that a close beyond
a broken trendline is needed to confirm a break.
-
The Two-Day Rule states
that the price must close beyond the trendline for two consecutive periods for the break to be
considered valid.
Price Filters
A trendline must be broken by a predetermined value or percentage amount (set by the dealer) before the
break is considered to be valid. Traders commonly use filters but they are a very personal thing. We
suggest experimenting and analysing the market before deciding on your filter. Employ
both Time and Price filters at the same time. Once your rules have been set it is important to maintain the discipline in the heat of the moment and stick to them.
1.4 Channels
A channel is an extension of the trendline. In an uptrend, the channel line is drawn parallel to the
trendline above the price action. In a downtrend, the channel line is drawn parallel to the trendline
below price action. The trendline and channel line should engulf the price action. Channels are more
useful to an analyst than a trendline because they identify a minimum price objective for the market
should the price break out of the channel.
The important line in a channel pattern is still the trendline. The channel line is purely a measuring
line and should not be used as a trading signal. It can be used as a take profit indicator, but it
should not be used to establish a position against the prevailing trend.
Once the channel line has been drawn on the chart, the width can be measured and projected from the
break of the trendline. This is the Minimum Price Objective (MPO).
Trendline is confirmed by the third touch . Parallel draw in with two touches. Sell expecting market to
go lower, still in downtrend. Stop and reverse above trendline currently @ 106.52.
Break above the trendline indicates potential trend reversal. Measure width of channel and project MPO
from the break out. Stop and reverse triggered so now long and carrying small loss.
The market moves strongly towards 61.8% of the Minimum Price Objective. It then retraces back to the
break out area - chance to buy more or establish a long position if the initial break was missed. Market
then moves stronger higher and forms a pennant (covered later in the patterns section), before another
strong move up to the MPO,.the market then moves higher again to find resistenace just below 161.8% of
the MPO, coinciding with the previous high in august. By this time the market had formed another channel
with the new uptrend.
1.5 Percentage Retracements
It was mentioned earlier that prices do not move in straight lines but with successive peaks and
troughs. Prices tend to retrace a certain percentage of the previous move before resuming the previous
trend.
The best known is the 50% retracement. In a downtrend for instance, prices may retrace 50%of the
previous decline before resuming the move in the original downward direction.This 50% level is a common
target for support in an uptrend (or resistance in a downtrend.)
Besides the 50% retracement, there are also minimum and maximum retracement parameters widely recognised
by chartists. A minimum retracement is one-third and a maximum retracement
two-thirds of the previous trend.
Even in a strong trend, the prices will tend to retrace at least one-third of the previous move, but if
the correction exceeds the two-thirds level, then the retracement is more likely to be a trend reversal,
(i.e. If the prior trend is to be maintained the correction should stop at the ⅔ point.)
Trading using Percentage Retracements
Percentage Retracements can be used for trading purposes, the goal of the system being to trade in the
direction of the main trend, but to take advantage of the reaction retracements to get favourable entry
and exit points. In an uptrend, the 33% - 50% area may be considered as a ‘buying zone’ under the market
and can be used to enter new (or add to previous) long positions.The same reasoning can apply to
downtrends where this 33%-50% zone may be considered as a selling area above the market. Notice here
that these zones may well coincide with actual trend lines discussed earlier in this chapter, thus
giving greater strength to these support or resistance levels.
These parameters (33-50-66) are taken from the Dow Theory, while Elliot Wave Theory and Fibonacci Ratios
lead to percentage retracements of 38.2% and 61.8%. Some technical analysts combine these two approaches
and use a minimum retracement zone of 33% to 38% and a maximum retracement zone of 62% to 66%.
Furthermore, users of Gann Theory divide price action into eighths with special importance being given
to ⅜ (37.5%), 4/8 (50%) and ⅝ (62.5%).
Widely recognised retracement parameters:
1.5.1 W. D. Gann (1878-1955)
William D Gann was a legendary stock and commodity trader who developed a unique combination of precise
mathematical and geometrical principles. His studies were based on the 'Squaring of time and price', as
he considered the duration of a price movement to be almost as important as the actual size of the price
change. Hence he concluded that:
- The longer the consolidations phase the longer the price movement after the breakout.
- A broken resistance level will become support, and vice-versa.
- When time and price are 'squared', a market turn is due. (i.e. Look for the combination of a key
price level occurring at a specific time interval).
In addition, the geometric form of 360 degrees in a circle was very significant to him.
Gann Retracements
In an uptrend, when the price has moved from a significant low and looks to have peaked, the question
arises 'At what levels might we find support as the price declines ?' Gann attempted to answer this
question using percentage retracements. Notice, of course, that retracement lines cannot be drawn until
a significant high has been made.
Gann divided price actions into eighths.
The most significant of these divisions was 4/8 (50%), which also happens to be the Fibonacci ratio
(1/2). 3/8 (37.5%) and 5/8 (62.5%) followed this. Notice that these numbers also correspond closely with
the Fibonacci retracements of 38.2% and 61.8%, which incidentally also have significance in Elliot Wave
Theory.
Less important fractions included 1/8, 2/8, 6/8 and 7/8, although 8/8 (100% retracement) was significant
as it signalled a full trend reversal and corresponded again with the Fibonacci ratio 1/1. As well as
eighths, Gann was also interested in 1/3 and 2/3 retracements (also Dow Theory minimum and maximum
retracements).
Gann Angles
In conjunction with percentage retracements, Gann employed geometric angles for relating price
h areas of potential future support and resistance. Using squared graph paper, he constructed lines
based on 'boxes up (or down) versus boxes to the right'.
The starting points for these angles were any significant tops or bottoms ,
so Gann's price charts soon became rather crowded! Firstly he drew the 1 by 1 primary bullish support
line up from a market bottom (or the primary bearish resistance line down from a market top). This line
represents a perfect balance between time and price. If the support line is broken downwards, this
usually indicates a further price drop to the next lower line. Correspondingly, if prices break upwards
through a resistance line, they would be expected to rally to the next higher one.
Chart Analysis combining Gann Angles and Retracements.
Although there are many angles and retracement lines that can be drawn, it is best to concentrate on the
most important ones. These are the 1x1, 2x1 and 1x2 Gann Angles, and the 3/8, 4/8 and 5/8 Gann
Retracements. (i.e. 50% retracement and the two Fibonacci ratios).
The next move is to find confirmation (or coincidence) between the two techniques, at which points there
should exist excellent support or resistance. The best example would be a 50% retracement of an uptrend
to the (1x1) 45-degree line, although any combination of line holds more weight as support or
resistance than any single line.
Applying Gann Theory in the Foreign Exchange Market.
As mentioned earlier, WD Gann was a trader of stocks and commodities, primarily trading grains for many
years. He observed that bull markets lasted longer than bear markets, and concluded that reversal
patterns reduce in magnitude as the move persists. The nature of the inflationary environment in which
we live is such that prices tend to increase in the long term, but an important condition here is that
the supply of the commodity is finite. In the FX market, however, it could be said that 'Dealers buy
what they don't want, and sell what they don't have'. This is made possible by the 'infinite' nature of
market, which may question the validity of Gann Theory when applied to Foreign Exchange.
Although Gann was a pure technician using charts for all his analyses,he was also a trader with a
trader's mentality. The rationale behind many of his theories was behavioural:
-
In a rising market Trader 1 takes a long position towards the end of the rise.
-
The market declines and he has an unrealised loss.
-
As soon as the price returns to his cost, he sells his position to Trader 2, and gets out
flat.
-
By selling he has automatically created resistance at that previous high level.
-
Trader 2 who bought the position sees it trade at this level for a while before moving higher.
-
Now he wishes he'd bought more at the lower level, but resolves to do so if the price
declines.
-
Trader 1 is angry that he sold when he did, and resolves to buy back if the price declines.
-
In the meantime, Trader 3 sold short when Trader 1 sold out, and has an unrealised loss.
-
He is in trouble, but also resolves to cover the short if the price declines.
-
Trader 4 has been long for months and starts selling to realise a large profit.
-
This causes the price rise to falter and retrace back towards the earlier resistance level.
-
Traders 1,2 and 3 are now alert, waiting for their chance to buy cheaply.
-
The percentage retracement depends on how keen Traders 1,2 and 3 are to buy.
In this way, Gann used his techniques to estimate where the most likely (and the most powerful) support
and resistance levels would be in the future. Although the infinite nature of the FX market makes it
fundamentally different to stocks and commodities, it is plain to see that the above scenario could just
as easily have been applied to the USD/EUR market, for example. Thus, it is fair to say that Gann's
techniques are valid when applied to the FX market, although there will always be sceptics who are not
soʻsure!
Trading Philosophy
Gann's belief in support and resistance was the backbone of his analyses, but he appreciated that price
moves were very seldom exact. The momentum which took prices slightly beyond their likely goals he
called 'lost motion' and his philosophy was based on 'targets' or 'target ranges' around his lines of
support and resistance. In conclusion, if asked how best to use his analyses, his advice would
be 'Conserve your capital and wait for the right opportunity'.
1.5.2 Fibonacci
History of the Fibonacci Sequence
Although use of the Fibonacci series can be found in such ancient monuments as the Parthenon in Greece
and the Great Pyramid at Giza, it was only formalised in 1202AD in a book by Leonardo of Pisa, writing
as Fibonacci called Liber Abace ('Book of Calculations').
This book actually introduced the Arabic (i.e. Base ten positional) numbering system to Europe, an
achievement that made Fibonacci the greatest mathematician of the Middle Ages. He also noted the
solution to the trivial 'rabbit' problem (detailed below), that the mathematician Lucas dubbed the
'Fibonacci Sequence' in the late nineteenth century.
The problem was this: How many pairs of rabbits could one pair produce, assuming that this initial pair
can reproduce in their first month, but subsequent pairs can only reproduce from their second month
onwards?
The answer produces this basic sequence:
1, 1, 2, 3, 5, 8, 13, 21, 34, 55, 89, 144, 233, 377, ...
Mathematical properties of the sequence
The sequence has four principal properties
These properties provide us with the most important Fibonacci ratios, 1.618 (the Golden Ratio) plus 0.618, 0.382 and 0.236.
These ratios display interesting properties.
The Golden Ratio
The Golden Ratio is of fundamental importance to geometry and is best shown with the aid of a
diagram.
This forms the basis of the construction of a Golden Rectangle,
where the sides are in the Golden Ratio to each other. This rectangle can be split into a square and
another Golden Rectangle, which can be similarly split, forming an infinite number of
squares/rectangles: this then becomes a Golden Spiral, as shown below.
This spiral is logarithmic, and so has two fundamental properties. It is infinite, and it retains the
same shape. These spirals appear in the human body (e.g. In the inner ear), in nature (e.g. The
distribution of seeds in a sunflower) and, on the largest scale of all, the universe. (Each arm of a
galactic spiral is logarithmic).
The sequence permeates the sciences, most noticeably in the newer disciplines of Chaos Theory and
fractional geometry (fractals).
Practical applications for Technical Analysis
The theoretical basis for using the sequence in analysing markets is the fact that the markets display
typical crowd behaviour. Self-organisation, irrational (emotional) behaviour, short time horizons and
dynamic growth to name but a few.
These characteristics allow us to estimate the behaviour of the markets from their past behaviour and it
has been found that the Fibonacci ratios are highly useful in achieving this.
It is worth pointing out that it is not the Fibonacci numbers that are important, but the ratios. These
ratios appear with great regularity in dynamic systems such as the financial markets. These ratios can
be applied in two dimensions: price and time.
a) Price
The ratios 0.236, 0.382 and 0.618 play
a fundamental role in the determination of retracement levels. The TraderMade Fibonacci retracement
system calculates levels at 23.6% , 38.2% , 50%, 61.8% and 100%.
(Note the close correspondence with Gann's retracement levels at 25%, 33%, 50%,
66% and 100%).
These retracement lines form support levels during the growth of an uptrend, and resistance after a
trend reversal as the markets react with typical crowd behaviour. Price ratios also play an important
part in Elliot Wave Theory in determining the extent of individual waves (and thus reversal points).
b) Time
The calculation of time cycles is a vast and rapidly growing subject. It forms the basis (along with
price ratios) of Elliot Wave Theory and is used in, for example, Carolan's Spiral Calendar.
The underlying concept of time cycle theories is that prices move in cycles of varying magnitude,
with smaller cycles going on to make larger cycles, and that cycles interact (either augmenting or
diminishing each other).
The key in these methods is to determine exactly where the market is in relation to these cycles. Once
this is known, then the timing (and size/nature) of positions becomes much easier to decide.
1.6 Speedlines and Fans
The speedline technique combines percentage retracements and trend lines.
Drawing a speedline
a) In an uptrend - Find the highest point in the current uptrend.
- Draw a vertical line down from that point to the level at which the trend began.
- Divide this vertical line into thirds.
- Draw two trend lines from the beginning of the trend through the one-third and two-third points on
the
vertical line.
b) In a downtrend the reverse process is applied. A vertical line is drawn upwards from the lowest point
to the level where the trend began, is divided into thirds and the same process is applied.
- Note that each time a new high (in an uptrend) or new low (in a downtrend) is achieved, a new set of
lines must be drawn.
- Well known variations of the speedlines technique just described are:
- Fibonacci Fan lines. These
lines are drawn in exactly the same way as speedlines except that the vertical line is divided at
the
23.6%, 38.2%, 50% and 61.8% levels.
- Gann Fan lines. Again
drawn the same way as speedlines, but this time the vertical line is divided at 25%, 33%, 50%, 66%
and
100%.
Theory
The theory behind the speedlines approach is similar to the percentage retracement technique.
If an uptrend is in the process of correcting itself, the downside correction will usually stop at the
higher speedline (2/3). If not, then the price will probably drop to the lower speedline (1/3). If this
line is also broken, then the price will probably retrace back to the level at which the
previous trend began. (i.e. The lines act as support during market corrections, but when they are
broken, they revert to resistance lines on bounces.)
Combining Retracements and Speedlines
The speedlines (and fans) and percentage retracement techniques seem even more effective when used
together.
Coincidence and therefore confirmation of support and resistance levels obtained on a chart by the use
of the two methods gives price levels of greater weight. For instance, a price decline to the 50%
retracement line and the 2/3 speedline at the same time should represent an excellent support level.
The breaking of such a confirmed support level as this would give more emphasis to the warning of a
possible trend reversal.
Chapter 3: Moving Averages
3.1 Introduction
Prices can only move in
three directions - up, down or sideways. The direction determines the trend, which is the most fundamental
concept in technical analysis. The purpose of all the tools used by technical traders is to identify
and evaluate the trend. A flat market may be referred to as being in a sideways trend, or trendless. Prices
do not move in straight lines, but pass through a series of peaks and troughs. The purpose of most technical
tools is to smooth out some of the "noise" that occurs in the market so that the underlying trend is more
easily viewed. The most widely used technical tool for this purpose is the moving average.
It must be noted at an
early stage, however, that all moving average systems work best in 'trending' markets. You will see that
using moving averages in a trendless market is one of the quickest ways to lose money, so beware! (There are
other tools that are designed for use in sideways trending markets, which can be seen in later chapters).
Questions to be answered before using moving averages: a) What type of Standard Moving Average
Moving Average, Weighted Moving Average
All three are explained
below. should I use? Exponential Moving Average b) What price There are many choices. High, low, open, close
or typical (which is during the day (high+low+close)/3), or another value such as the day's midpoint value,
etc. should I use? However, by far the most popular value is the closing price, as it is considered to be
the most significant price of the day. c) What degree of Sensitivity can range from being very 'fast' (i.e.
2 or 3 days) to very 'slow' sensitivity do (i.e. 200 days). require?
Using a fast moving Using
a slow moving average: average:
+ They give a better
view of the general trend. + Trading signals are + They are suitable for use in
long-trending given early in the markets. move.
+ They do not get caught
in small corrections in + Signals may be given long trends. against the trend. - They track the
trend from a greater distance,
- Some false signals
hence giving trading signals later. may be generated by - They are unsuitable in trendless markets, as
market 'noise'.
the price whipsaws around
the line. The more sensitive the
moving average, the
earlier the signals and the greater the possibility of false signals or being “whipsawed". The less
sensitive the moving average the later the signals to get both in and out of a position. The best moving
average to use would be the one that is sensitive enough to give early signals, but insensitive enough to
avoid most of the "noise" signals. Easier said than done! d) Where on the Most technical traders place the
latest moving average value on the last price chart price value. Others prefer to shift (or 'displace') the
moving average. should the This will cause the Moving Average to lead the market or to lag the market moving
average even further. Centring of the moving average (placed in the middle of the is positioned? period
covered) is a statistically correct method for placing the moving average, although this is mostly used to
isolate underlying cycles.
3.2 Types of Moving Average
3.2.1 Standard
For an 'n' day moving average, simply add up the last 'n' prices and divide by 'n'

Where P5 is the most recent price. Notes: The same weight is given to each price.
Only the prices in the period covered are taken into account.
3.2.2 Linearly Weighted
This is the most sensitive (or 'fastest') moving average system of the three described here, as greater
weight is given to more recent prices.

Where P5 is the most recent price. Notes: Greater weight is given to the more recent prices.
Only the prices in the period covered are taken into account.
3.2.3 Exponential
For an 'n' days moving average,

Where 2 / n+1 is called the exponential constant. Notes: Greater weight is given to the more recent prices
All previous prices are taken into account in its calculation.
3.3 Trading Systems
3.3.1 One Moving Average
The moving average is drawn on a price chart. Buy signals are generated when the price moves above the
moving average, and conversely, sell signals are given when the price moves below the moving average.
To avoid most of the false signals when using a single moving average, some traders wait for a signal
to be confirmed - by using candle chart analysis, or looking for the break of a trendline, for example.
Others impose time or price filters (as we saw with support and resistance studies) on their moving
average signals.
Confirmation.
- The moving average and price line must have the same direction.
- The entire day's price range must confirm the signal.
- The signal must be confirmed by a different signal (e.g. Channel breakout).
Filters.
Price filters. The price must penetrate the moving average by a certain predetermined percentage
of the current price or by an absolute price value (set by the user).
Example 1: Percentage envelopes. Parallel lines are drawn at a certain percentage above and below the
moving average. Then, to generate a sell signal, the price has to close not only below the moving
average but also below the lower envelope line. Then a close above the moving average itself leads to
the liquidation of the position. A buffer 'neutral zone' is created between each of the percentage
envelopes and the moving average, within which no action is taken.
Example 2: High-Low band. Identical moving averages are applied to the highs and the lows of each day.
A buy signal is generated when the price crosses above the higher line and then the lower line is used
to generate the stop out point. Conversely, a sell signal is generated when the price crosses below the
lower line, and the upper line then becomes the stop out point.
The same comments can be made on the filter's choice as on the choice of the moving average's duration.
If the filter is not effective enough, it is not much use in reducing the false signals, but if it is
too effective, then an important part of a price movement will be missed before a signal is triggered.
The dealer has to determine which filter is the most appropriate to the market.
Time filters. The user delays for 'n' (usually 2 or 3) days before taking any action. (i.e. The
signal must remain in force for more than one day). In this way, a lot of
false signals are
avoided, but there is the inevitable disadvantage of
later entry into good trades.
Conclusion.
Sometimes a short moving average will work better than a longer moving average and vice versa. Thus,
the use of one moving average may not always give the best results, necessitating the use of filters.
Therefore, to improve the reliability of this method, most technical traders prefer to use two or three
moving average systems.
3.3.2 Two Moving Averages
When using two moving averages, the long one is used for trend identification and the short one as a
timing technique. Different rules may be used:
1) A buy signal is given when the short moving average crosses upwards through the longer one, and a
sell signal is given when the short moving average crosses downwards through the longer one. E.g. If a
5-day and 20-day combination is used, a buy signal is given when the 5-day moves above the 20-day, and
vice versa for a sell signal. In this approach, the system is continuous, meaning that it is in the
market (long or short) all the time. It gives:
+ Less false signals than using one moving average, but
- More lagging than using one moving average.
2) A buy signal occurs when the price moves above both moving averages and a close out signal is given
when the price moves below either moving average. (Vice versa for a sell signal). In this approach, the
system is not always in the market. A neutral zone is created where no position is taken or kept. Some
traders also wait for a confirmation - i.e. Buy signals are only acted upon when the shorter moving
average crosses above the longer moving average AND when the latter is itself increasing; sell signals
are given when the shorter moving average crosses below the longer one AND when the latter is itself
decreasing.
3.3.3 Three Moving Averages
For the three moving average systems, different
techniques may be used to
calculate the signals. As for the two moving average systems, we can classify these systems into two
categories with respect to their presence in the market.
Continuous systems and non-continuous
systems.
-
Continuous systems. A buy signal occurs when the shorter moving average crosses above the
longer one, and a sell signal occurs when the shorter one crosses below the longer. b)
Non-continuous systems. A neutral zone is created when the shortest moving average crosses one
of the other two. The trigger signal is the crossing of the shortest with the third one.
-
Non-continuous systems. A neutral zone is created when the shortest moving average
crosses one of the other two. The trigger signal is the crossing of the shortest with the third
one.
-
Triple cross-over method. As stated before, the shorter the moving average, the closer it
follows the trend. For a three moving average system, M1, M2 and M3 (with M1 being the shortest
and M3 the longest), in an uptrend, the proper alignment should be M1 above M2 above M3
(M1>M2>M3), while in a downtrend, the respective values should be M1
. (i.e. A sell signal is given at the moment the situation M1
occurs). When the uptrend reverses, the first thing that should happen is that the shortest
one (M1) crosses below the other two - this is a selling alert. When M2 crosses below M3,
the signal is triggered. However, these rules can be adapted by the user, and some
dealers use the first crossing to start liquidating their long positions.
Chapter 4: Oscillators
4.1 Introduction
Moving averages, trendlines and channels are technical tools that are essentially trend following (i.e. They
may be optimised to identify new trends as soon as possible but will always give the signal after the trend
reversal has taken place).
However, oscillators may be used to warn of a trend reversal before the prices
reach the actual top or bottom (deceleration of the price increase/decrease). Especially valuable towards
the end of market moves, they may signal that a trend is close to its final stage by showing
divergence.
When used in conjunction with price charts during trending phases, they indicate:
-
Overbought & Oversold situations (ie. Short-term market extremes, where the price has
moved too far, too fast').
-
Divergence situations. Usually the oscillator and the price lines have parallel paths, but when
their paths diverge - when the oscillator is in an extreme position (i.e. > 100% or < 25% - it is
usually
a warning that a trend reversal is imminent. There are two different kinds of divergence:
- The price is rising & the oscillator falling.
- The price is falling & the oscillator rising.
-
The crossing of the 'zero line' may be used for generating trading signals, in the direction of
the existing trend:
a) Buy when the values turn from negative values to positive values (or depending on the formula
used, from values < 50% to values > 50%), in an uptrend.
b) Sell when the values turn from positive values to negative values (or from values > 50% to
values < 50%), in a downtrend.
4.2 Types of oscillators
Oscillators are indicators of
|
a) Overbought or Oversold situations
|
|
b) Divergence situations
|
Some measure the rate of change of prices to indicate if the existing trend is accelerating or decelerating
(i.e. The market move is coming to an end).
Momentum & Rate Of Change:
|
acceleration/deceleration, overbought/oversold.
|
Moving Averages:
|
acceleration/deceleration, overbought/oversold, trading
signals.
|
Relative Strength Index:
|
overbought/oversold, divergence.
|
Stochastics & Slow Stochastics:
|
overbought/oversold, divergence, trading signals.
|
Larry Williams:
|
overbought/oversold.
|
4.2.1 Momentum & Rate Of Change
We can deal with these two oscillators simultaneously because their interpretation is similar. Both give a
measure of the rate of ascent or descent of the price. (i.e. The acceleration or deceleration of the trend).
There are 3 scenarios for an uptrend (and 3 for a downtrend - in brackets):
a) When the price is rising (falling) and the oscillator is above (below) the 'zero line', with a
positive (negative) angular coefficient, the uptrend (downtrend) is accelerating.
b) When the price is still rising (falling) and the momentum line is above (below) the 'zero line' but
the angular coefficient tends toward zero, the rate of ascent (descent) is levelling off. c) When the price
is still rising (falling) and the momentum line is above (below) the 'zero line' but
the momentum's angular coefficient has turned to a negative (positive) value, the price line and the
momentum line start to move in opposite directions. This situation is known as a divergence.
Calculations
For example, if P is today's closing price and n=10, then the 10-day momentum is the difference between the
today's closing price and the closing price 10 days ago.
For example, if P is today's closing price and n=10, then the 10-day ROC is simply today's closing price
divided by the closing price 10 days ago.
Notice that in this case the 'zero line' is actually the 'one line'. Note also that some analysts like to
multiply the result by 100 (to give a more easily readable value), giving a '100 line'.
The lines obtained by either method look very similar and are interpreted the same way:
Some technicians for generating trading signals use the crossing of the 'zero line' or the ‘one line'
se of the ROC, but momentum signals have to be co-ordinated with the existing trend. The crossing of
the 'zero (one) line' should be taken as a selling signal only in a downtrend.
4.2.2 Moving Averages & MACD
These oscillators measure the trend acceleration or deceleration. As the speed of the price move accelerates,
the moving average line will also accelerate (although it will be lagging behind).
It is calculated by plotting the difference between a short-term moving average (Ms) and a longer term one
(MI). What happens is that MI is 'flattened out' to become the 'zero line' of the oscillator, and Ms
then oscillates around this line as the difference between the two values varies. Presenting the data in
this form has the advantage of highlighting the classic trading signals of a two moving average system
(crossing of the 'zero line')
Overbought (or oversold) situations are spotted when the short-term moving average moves too far above (or
below) the long-term moving average (i.e. The 'zero line'). This short term variation from the long term
trend usually announces a pause in the market until the shorter-term moving average moves back towards the
long-term one.
Trading Signals
a) If Ms approaches Ml but bounces off it, then this usually represents a good buy (sell) area in
an uptrend (downtrend). (i.e. The trend is accelerating again after a pause).
b) If, however, Ms approaches Ml and crosses it, then this signals a trend reversal.
MACD (Moving Average Convergence/Divergence)
MACD is an extension of the Ms, MI oscillator system above, except that in this case both Ms and MI are
exponential averages. Once the Ms, MI oscillator has been drawn, the MACD ('signal line') can be plotted by
calculating the exponential moving average of the difference between Ms and MI. The resulting line is called
the 'Signal line'.
This gives a second line on the oscillator (making a total of 3 if we include the MI 'zero line'), which lags
behind Ms. For convenience, we will call this MACD line 'Mm'.
Trading Signals
a) A buy (sell) signal is generated when Ms crosses above (below) Mm.
b) Divergences can also be found, although the buy or sell signal is only confirmed once the 'zero
line' is crossed by both Ms and Mm.
c) Trend lines can also be drawn on the oscillator, so that a break of a trendline on the actual
oscillator, for example, could warn of a trend reversal before the price breaks its equivalent
trendline.
4.2.3 Relative Strength Index (RSI)
A simple observation made here is that, in an uptrend, each closing price is likely to be higher than the
previous one, and in a downtrend, each closing price is likely to be lower than the previous one. The
official definition of relative strength index is:
where RS is the ratio of the number of points gained (close-to-close) on each 'up day' to the number of
points lost (close-to-close) on each 'down day', during the past 'n' days.
A simpler way of looking at this can be derived by rearranging the above formula to give:
Compared to the previous oscillators (Momentum, ROC, Moving Average and MACD) the RSI may be called a
'smoothed' oscillator because, for example, even if the price is currently very stable, the momentum or ROC
line can still show erratic movements if there has been a sharp price movement 'n' events ago.
As mentioned above, one of the advantages of oscillator analysis is to point out short-term market extremes.
For this purpose, the constant 0 to 100% RSI scale is very useful in order to compare different situations,
and it gives the possibility of identifying 'danger zones' corresponding to overbought and oversold
situations. Generally, an RSI value above 100% indicates an overbought situation whilst a value below 25%
indicates oversold. However, the user should be flexible here, as 80% & 20% seem to be more appropriate in
strong trending markets, while values 70% & 30% may be used in 'trading' markets.
The oscillator's first move into the overbought area (oversold for a downtrend) should only be considered as
a warning. Indeed, any strong trend produces extreme values for the RSI, and in strong markets the
oscillator line may remain in an extreme zone for some time.
Divergence
A possibility of a divergence situation exists:
a) When the oscillator moves for a second time into the extreme zone.
b) When this second move fails to confirm the price move into new highs (or lows), forming a
double top (or bottom) on the oscillator.
The second (or third!) time the oscillator moves into the extreme zone and diverges from the price line, the
boundaries of the extreme zone may be used to generate trading signals. Long positions should be liquidated
when the oscillator is above the 100% line, and a crossing back under this 100% line can then be used as a
sell signal. The same applies to short positions around the 25% zone.
NB : Caution is urged when trading on these signals, as the oscillator may enter the extreme zone
.e. You may have sold as the RSI crossed below the 100% line for the 2nd time, but it is possible that the
price may then recover to make an even higher high (after only a small decline) as the RSI re-enters the
overbought zone. It is therefore advisable to seek confirmation from other tools to avoid potential bad
trades.
4.2.4 Stochastics & Slow Stochastics
These oscillators are based on two fairly straightforward observations. In an uptrend, today's closing price
is likely to be close to the highest value recorded over the last few days. Conversely, in a downtrend,
today's closing price is likely to be close to the lowest value recorded over the last few days. As with all
oscillators, the exact number of days (parameter) is set by the user. Unlike the RSI, the stochastic
oscillator uses two lines:
The Percentage Alert line: %K (sometimes called %A), and
The Percent Definite line: %D.
The formulae used to determine both lines are given using a popular parameter set: 5 and 3 days.
Percent Alert
%K represents a measure (on a percentage basis) of the last closing price within the price range of a chosen
period (here 5 days):
Where C is today's close,
L5 is the lowest low during the last 5 days, and
H5 is the highest high during the last 5 days.
A closing price near or equal to the top of the price range will give a high value to the %K line, while a
close near or equal to the bottom of the price range will give a low reading.
Percent Definite
%D is in this case) a three day 'moving average' of %K such that:
Where h3 is the 3-day sum of (C - L5), and * 13 is the 3-day sum of (H5 - L5).
The same 100% and 25% values are used to identify overbought and oversold situations. Divergences are
used the same way as with the RSI. The signal to watch for is a divergence between the %D line and the
underlying price when the %D line is in the overbought (or oversold) zone. Divergence should always be
confirmed by a break of a trendline. When confirmation is given this signal is usually very strong and
accurate.
Slow Stochastics
A slower version of the two lines seemed to be preferred. In this version, the %K line is dropped and a new
line is plotted which is the %Dn line. This is a moving average of the %D line. The Slow Stochastic gives a
smoother view of market movements and removes many false signals.
Chapter 5: Parabolic and Weekly Rules
5.1 Parabolic
This is a trend following, a mechanical trading system developed by J. W. Wilder. The name was derived from the
pattern formed by the stops. The system is a true reversal system, each point on the line plotted is a
reversal point (SAR). If the market reaches the SAR point a signal to reverse the position is given. This
initiates a new position.
Each day the SAR for the following day is calculated using either of 2 formulas:
The SAR moves only in the direction in which the trade has been initiated.If long, the stop will move
up every day; if short, the stop will move down (regardless of the direction the price has been moving).
The amount by which the stop moves up or down is a function of:
- a) Extreme Point (EP) = the most favourable price reached since the trade was initiated.(i.e. The
highest high when long, or the lowest low when short).
- b) Acceleration Factor (AF). The AF value starts at 0.02 and is increased by 0.02 each time a new EP for
the trade is made until it reaches 0.2
When a new trade is initiated, the initial SAR is the previous trade's EP, allowing time for the trend to
materialise. If the trend fails to materialise, then the system is stopped and the position reversed.
Three situations are encountered during a trend period and usually occur in the following order:
- a) Both the values of EP and AF increase. Every time a new EP is reached for the trade, AF is
increased by 0.02 - As the AF increases, the SAR curve begins to move faster towards the
price.
- b) The EP value increases and AF has reached its maximum value of 0.2 - The SAR is then a
function of price only.
- c) The values of both EP and AF are constant. No new EP (no higher high or lower low) is made
for the trade (AF value is not increased). The trend falters and the result is usually that the
SAR curve catches up with the price action.
The Parabolic is a sensitive system reacting to relatively minor market moves, which implies that it gets
whipsawed during sideways, non-trending periods. To reduce the number of whipsaws, one possible solution is
to use Wilder's Directional Movement Index as a filter and to follow only those signals which are in the
same direction as the DMI lines. (See later Chapter).
5.1.1 Using the Parabolic
A position is taken when a price penetrates a SAR (or any time provided that it is taken in the direction of
the existing trend). If Long, the EP = highest high made during this trade.
Then, every time today's high is higher than the previous EP, the acceleration factor is increased by .02
until AF = 0.2. Note that the calculated SAR must be < today's and yesterday's low - If not, the lower of
these two lows is used for tomorrow's SAR.
If Short, the EP = lowest low made during this trade.
Then every time the low for today is lower than the previous EP, the AF is increased by 0.02 until AF = 0.2.
Note here that the SAR calculated for tomorrow must be > today's and yesterday's high - If not, the higher
of these two highs is used for tomorrow's SAR.
At the closing of the market, tomorrow's SAR is calculated using the above formula with today's values for EP
and SAR, the acceleration factor being given the appropriate value.
If during the day (SARn) the signal is triggered (i.e. The SAR value has been penetrated), then the position
is reversed and the SAR for the next day (= SAR(n+1)] is calculated with:
- SARn = Extreme point reached while in the previous trade
MA
(= Highest high, if the position is reversed from long to short, or
= Lowest low, if the position is reversed from short to long).
- EPn = HIGHn (if reversed to long) or LOWn (if reversed to short)
- AF = 0.02
5.2 Weekly Rule
The Four-Week Rule (or Donchian Rule) is a very simple trend-following mechanical system, which is continuous
by nature. (i.e. It is always in the market, either long or short). It is a channel breakout system in which
the previous twenty days (i.e. Four full calendar weeks) are examined
and the system goes (or stays) either:
- a) Long - When the price exceeds the highs of the four preceding weeks, or
- b) Short - When the price falls below the lows of the four preceding weeks.
Practical Approach
Count back twenty days and find the highest high and the lowest low in that period. These two points define a
channel parallel to the x-axis. If today's action is:
- a) Above the upper value, then short positions are liquidated and long positions are taken (or
kept).
- b) Below the lower value, then long positions are liquidated and short positions are taken (or
kept).
- c) Within the channel, then the current position is maintained.
Note: If both parts of the channel are penetrated in one day, then only the first signal is taken.
Variations
This model can be modified by using a different time period.
- a) Shortening the period leads to a more sensitive system, which may therefore get caught up in
minor corrections (signalling trades against the prevailing trend), but it will be better when the
trend is in the process of reversal.
- b) Expanding the period suits a 'trading' (sideways) market better, as no signals will be generated
until an important trend signal is given. The original system can also be modified to make it
non-continuous. In this case, a four-week rule is used to initiate a new position, but only a
one or two-week rule is used to liquidate the position.
There are three different variations on the original model whose adjustable parameters are as follows:
- a) The prices which define the channel (giving buy and sell signals); either the highest and lowest
close , or the highest high and the lowest low over the period chosen
- b) The price on which the signal is executed: either the close, or action is initiated on penetration
(i.e. Stop orders are used).
The length of the 'weekly rule' can be adjusted, and the three models are continuous systems.
- 1. Intra-day Close. The highest and lowest closes of the last 'n' days are found: (CHN & CLn).
Then, buy if the price on the day (n+1) > CHn, sell if the price on day (n+1) < CLn, or keep the current
position if the price remains within the channel's limits.
- 2. Inter-day Close. This model operates under the same assumptions as the Intra-day close model, except
that the signal is executed on the daily close.
- 3. Intra-day Extreme Price. This model also operates under the same assumptions as the Intra-day Close
model, except that the high value of the channel is the highest high, and the low value is the lowest
low of the last 'n' days. This last model is the original Donchian rule with n = 20 days.
Chapter 6: Wilder's Directional Movement Index (DMI)
6.1 Introduction
Technical trading systems such as moving average systems give high returns in 'trending' markets. On the
other hand, non-trending systems (such as oscillators) may be used in 'trading' markets. If a
trend-following method is used, the instruments, which are in directional markets, should be traded and it
would therefore be interesting to determine if a currency is trending before following the buy and sell
signals. To determine whether or not a market is 'trending' Wilder's Directional Movement Index (DMI) has
been developed to identify a trending market and to provide an indication of the extent of this trend.
The DMI consists of two lines +Dlp and -Dlp, the first one being a measure of uptrend and the second one a
measure of downtrend.
A third line, ADX (Average Directional Movement Index) is an indicator of how much the market is trending
(either up or down). The higher the ADX line, the more the market is trending and the more suitable it
becomes for a trend-following system.
Wilder's ADX line rates the directional movement on a scale of 0 to 100%. The higher the ADXR line value, the
more trending the market. When the ADXR line is below 25%, it indicates a 'trading' market (which is not
suitable for trend-following systems). Non-trending systems, however, such as oscillators or support and
resistance lines could be used.
Directional Movement lines may be used as a system on their own or as a filter on a trend following system.
The crossing of the two lines generates buy and sell signals. Buy when +Dlp crosses above -Dlp, and sell
when -Dlp crosses above +Dlp.
6.2 Calculating DMI
6.2.1 Directional Movement (DM)
The basic statement is that the trend is defined as a directional movement. The increment of directional
movement, +DM/-DM, is defined as the largest part of today's range that is outside yesterday's range.
If the largest part of today's range is above/below yesterday's range, the +DM/-DM will be incremented
(Directional Movement must be either up or down).
The second step is then to relate this Directional Movement to the price range.
6.2.2 Today's True Range (TR1)
- a) D1 = 1H(n+1) - L(n+1)| (The distance between today's high & low)
- b) D2 = |H(n+1) - Cn (The distance between today's high & yesterday's close)
- c) D3 = |L(n+1) - Cn| (The distance between today's low & yesterday's close)
6.2.3 Directional Indicator (DI)
To make directional movement relative to the range, Directional Movement is divided by the True Range. For
one day (today is either up or down):
- On up days, (+D11) = (+DM1) / TR1 (= percentage of the True Range that is up), and
- on down days, (-D11) = (-DM1)/ TR1 (= percentage of the True Range that is down).
Then Dip is calculated by summing up the DM1 and the TR1 over a period 'p', so:
- (+Dlp) = (+DMP) / TRp, and (-Dlp) = (-DMp) / TRP
Once the first Dlp has been determined, an accumulation technique is used to determine the Di's for the
following days. The sum (+Dlp)+(-Dlp) is the percentage of the True Range that was directional (either up or
down) over period p.
The difference (+Dlp) - (-Dlp) is the True Directional Movement. The greater the difference between (+Dlp) &
(-Dlp), the more trending the movement is in a certain direction:
- If (+Dlp) > (-Dlp), then the trend is up
- If (+Dlp) < (-Dlp), then the trend is down
- if (+Dlp) = (-Dlp), the trend is non-directional. (Equilibrium point).
6.2.4 Directional Movement Index (DX)
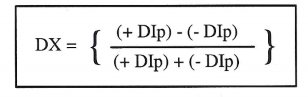
and has a value between 0 and 100.
The higher the DX, the more directional the movement, either up or down, so:
- As the price is going up, (+Dlp) > (-Dip) and DX will increase
and
- As the price is going down, (-Dlp) > (+Dlp) and DX will increase
Both the up move and the down move represent good directional movements.
If (+Dlp) = (-Dlp), an equilibrium point is reached and DX = 0.
When the price curve is flattening out, the difference between (+Dlp) and (-Dlp) will decrease.
(I.e. The price is moving non-directionally).
6.2.5 Average Directional Movement Index (ADX)
ADX is the 'p' moving average. of DX. The peaks and troughs of the ADX curve indicate a change of
direction.
If the major trend is down, then peaks = low price points, and troughs = high price points.
If the major trend is up, then peaks = high price points, and troughs = low price points
The higher the amplitude (peaks and troughs) of the ADX curve, the more directional the movement is in one
direction (either up or down). The greater the distance between the peaks and troughs of the ADX curve, the
greater is the reaction to the trend.
6.2.6 Average Directional Movement Index Rating (ADXR)
ADXR is simply the ADX today plus the ADX 'p' days ago, all divided by 2.
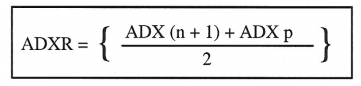
and has a value between 0 and 100.
This curve is used to rate the different instruments on a directional movement scale.
6.3 DMI Systems
- 1) A buy signal is given when +Dlp crosses over -Dlp and a sell signal is given when -Dlp crosses
over +Dlp. In this approach the system is continuous in the market all the time, long or short).
This
system can be compared to moving averages' system, the signal being the rate for which a crossing
will
occur. Nevertheless, the main difference is that DMI systems are dynamic systems, the signal
calculation
has to take into account the daily price range.
The ADX curve may be used as a filter on the Dlp signals:
- a) The Dlp crossings are not taken into account when ADX is below the 25% line and the
current position is kept as long as the ADX curve remains below this limit. When the ADX line
crosses
over the 25% line, the open position is kept or reversed, regarding the relative
position of the +Dlp and -Dlp curves
- b) The Dlp crossings are not taken into account when ADX crosses below the 25% line but
the current position is closed. No position is held as long as the ADX curve remains below this
limit.
The system is re-entered if the ADX line crosses over the 25% line, a long (short)
position being taken if +Dlp is above (below) -Dlp.
- 2) Extreme Points System
On the day the two lines cross, the extreme price made that day is used as the reverse point:
- If the position is long, the trigger signal is the Low
- If the position is short, the trigger
signal is the High
-
If the high (low) point made on the day of crossing is not penetrated, the current short (long)
position is kept.
-
If the high (low) point is penetrated, the position is reversed and the next signal will be the
low (high) price made on the day the two Dlp lines cross.
The ADX curve may be used as a
filter on the signals as described above.
Chapter 7: Popular Parameters
Relative Strength Index (RSI)
J Welles Wilder, in his book "New Concepts in Technical Trading Systems", used the RSI
Long-term
|
14 days (= One half moon cycle)
|
Very long-term
|
21 weeks
|
Long-term
|
21 days (1 Month)
|
|
10 days (2 weeks), or 9 days (reacts a bit faster than the 10-day)
|
Medium-term
|
24 hours (or 22 hours)
|
Intra-day
|
15 minutes or 25 minutes (for non-volatile markets)
|
Stochastics
(Note that Slow Stochastics are more popular than Normal stochastics) Lane devised his own stochastic
parameters
Chart Type
|
1st Number
|
2nd Number
|
3rd Number
|
Long-term (Daily bars)
|
%K = 5
|
%D = 3 |
%Dn = 3 |
| or |
%K = 10
|
%D = 6 |
%Dn = 6 |
| or |
%K = 15 etc.
|
%D = 9 etc. |
%Dn = 9 etc. |
Medium-term (Hourly bars)
|
%K = 22
|
%D = 15 |
%Dn = 15 |
| or |
%K = 15
|
%D = 14 |
%Dn = 14
|
| or |
%K = 8
|
%D = 5 |
%Dn = 5 |
Short-term (10-min bars)
|
%K = 15
|
%D = 9 |
%Dn =9 |
Larry Williams, for long-term charts used %R = 10 days.
Moving Average Convergence/Divergence (MACD)
Appel devised his parameters using an optimisation on the Silver market
Long-term
|
12, 26 and 9 days
|
Some variations of Appel's values are also popular for MACD
Long-term
|
10, 20 and 10 days, (i.e. 2 weeks, 4 weeks, 2 weeks), or
|
|
10, 20 and 9 days (which gives slightly earlier signals)
|
|
|
Directional Movement Indicator (DMI)
Wilder's DMI : Long-term 14
|
14 Days |
10 days
|
10 days |
| Medium-term |
24 hours or 12 hours (1 day or 1/2 day) |
Moving Averages
(Standard moving averages seem to be most popular)
| Long-term |
13, 21, 34 & 55 days (Fibonacci Numbers, with 21 = 1 monthly cycle)
|
|
5, 10, 20 & 40 days (=1 week, 2 weeks, etc.)
|
|
200 days (or 200 weeks for very long-term) Medium-term
|
| Medium-term |
18 hours |
| Intra-day |
60 monute or 120 minute (=1 hour or 2 hour) |
|
|